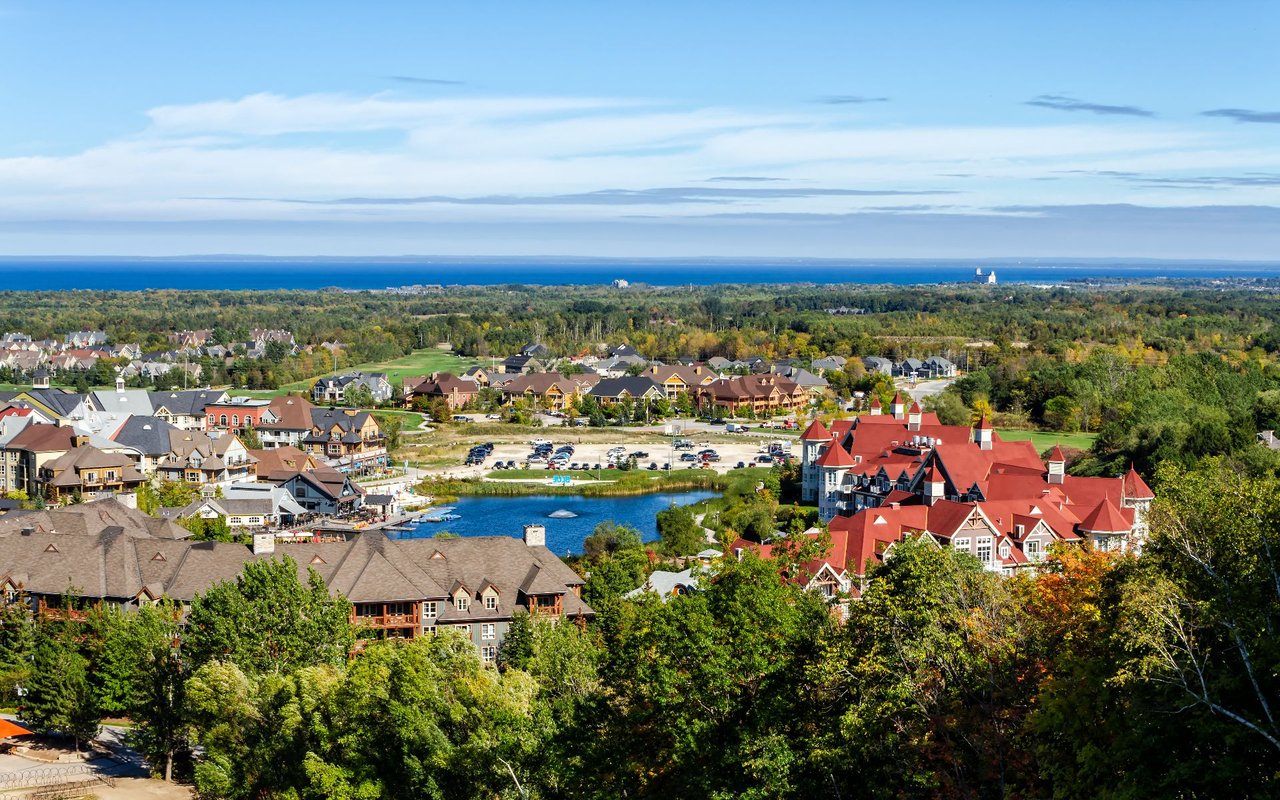
24,811 people live in Collingwood, where the median age is 50.8 and the average individual income is $112,200. Data provided by Statistics Canada.
Total Population
Median Age
Population Density Population Density This is the number of people per square mile in a neighborhood.
Average individual Income
There's plenty to do around Collingwood, including shopping, dining, nightlife, parks, and more. Data provided by Walk Score and Yelp.
Explore popular things to do in the area, including The Tremont Cafe, Nicky’s Doughnuts and Ice Cream, and Brunello.
| Name | Category | Distance | Reviews |
Ratings by
Yelp
|
|---|---|---|---|---|
| Dining | 0.19 miles | 9 reviews | 5/5 stars | |
| Dining | 0.12 miles | 6 reviews | 4.8/5 stars | |
| Dining · $$$ | 0.19 miles | 29 reviews | 4.7/5 stars | |
| Dining · $ | 0.16 miles | 7 reviews | 4.6/5 stars | |
| Dining | 0.33 miles | 16 reviews | 4.6/5 stars | |
| Dining · $$ | 1.43 miles | 16 reviews | 4.6/5 stars | |
| Dining | 4.64 miles | 3 reviews | 5/5 stars | |
| Dining | 0.28 miles | 6 reviews | 4.5/5 stars | |
| Dining | 0.19 miles | 3 reviews | 5/5 stars | |
| Dining · $$ | 0.27 miles | 8 reviews | 4.5/5 stars | |
| Dining | 0.93 miles | 6 reviews | 4.5/5 stars | |
| Dining · $$ | 0.98 miles | 14 reviews | 4.5/5 stars | |
| Dining · $ | 0.71 miles | 34 reviews | 4.4/5 stars | |
| Dining · $ | 4.55 miles | 33 reviews | 4.4/5 stars | |
| Active | 4.32 miles | 3 reviews | 5/5 stars | |
| Active | 4.55 miles | 3 reviews | 5/5 stars | |
| Active | 1.01 miles | 6 reviews | 4.5/5 stars | |
| Active | 4.52 miles | 11 reviews | 4.5/5 stars | |
| Nightlife | 0.16 miles | 17 reviews | 4.5/5 stars | |
|
|
||||
|
|
||||
|
|
||||
|
|
||||
|
|
||||
|
|
Collingwood has 11,175 households, with an average household size of 2.2. Data provided by Statistics Canada. Here’s what the people living in Collingwood do for work — and how long it takes them to get there. Data provided by Statistics Canada. 24,811 people call Collingwood home. The population density is 1.567 and the largest age group is Data provided by Statistics Canada.
Total Population
Population Density Population Density This is the number of people per square mile in a neighborhood.
Median Age
Population by Age Group
0-9 Years
10-19 Years
20-24 Years
25-64 Years
65-74 Years
75+ Years
Education Level
Total Households
Average Household Size
Average individual Income
Households with Children
With Children:
Without Children:
Marital Status
Blue vs White Collar Workers
Blue Collar:
White Collar:
Collingwood has 11,175 households, with an average household size of 2.2. Data provided by Statistics Canada. Here’s what the people living in Collingwood do for work — and how long it takes them to get there. Data provided by Statistics Canada.
Total Population
Population Density Population Density This is the number of people per square mile in a neighborhood.
Median Age
Men vs Women
Population by Age Group
0-9 Years
10-17 Years
18-24 Years
25-64 Years
65-74 Years
75+ Years
Education Level
Total Households
Average Household Size
Average individual Income
Households with Children
With Children:
Without Children:
Marital Status
Blue vs White Collar Workers
Blue Collar:
White Collar:
Experience a real estate partnership built on trust, expertise, and genuine care. We bring a lifelong understanding of what “home” truly means to every client and every decision.